The following plots display data exam scores for two different statistics classes. 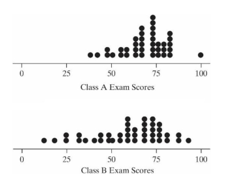
-Which class had a larger standard deviation of exam scores?
A) Class A
B) Class B
C) The two classes had approximately the same standard deviation.
D) This cannot be determined from the information given.
Correct Answer:
Verified
Q21: The plots below were created using a
Q22: The plots below were created using a
Q23: The plots below were created using a
Q24: Which of the following variables are likely
Q25: Which of the following variables are likely
Q27: The following plots display data exam scores
Q28: The following plots display data exam scores
Q29: Which of the following sets of numbers
Q30: Which of the following sets of numbers
Q31: A histogram that has the majority of
Unlock this Answer For Free Now!
View this answer and more for free by performing one of the following actions

Scan the QR code to install the App and get 2 free unlocks

Unlock quizzes for free by uploading documents