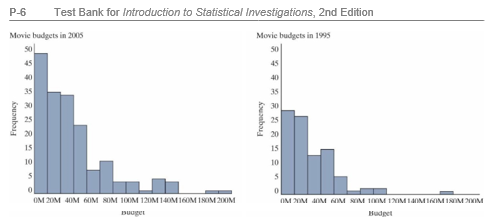
The plots below were created using a data set containing information about movies re-leased in 1995 and 2005. Note: M = million. 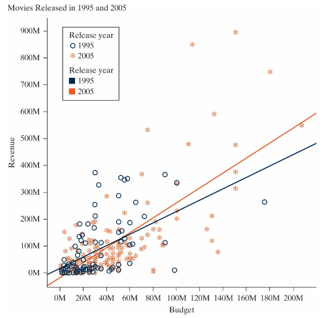
-Which year had a higher mean movie revenue?
A) 1995
B) 2005
C) The two years had the same mean movie revenue.
D) This cannot be determined from the information given.
Correct Answer:
Verified
Q16: A meteorologist is hoping to find a
Q17: The plots below were created using a
Q18: The plots below were created using a
Q19: The plots below were created using a
Q20: The plots below were created using a
Q22: The plots below were created using a
Q23: The plots below were created using a
Q24: Which of the following variables are likely
Q25: Which of the following variables are likely
Q26: The following plots display data exam scores
Unlock this Answer For Free Now!
View this answer and more for free by performing one of the following actions

Scan the QR code to install the App and get 2 free unlocks

Unlock quizzes for free by uploading documents