Explain what is misleading about the graphic.
-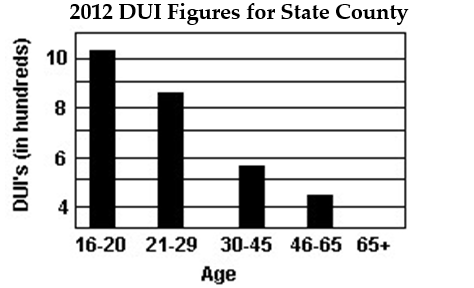
A) The graphic is not misleading.
B) The graphic only includes information for one year.
C) The horizontal scale does not begin at zero.
D) The graphic may give the impression that drivers over age 65 had no DUI's in 2012.
Correct Answer:
Verified
Q20: Determine the original set of data.
-
Q21: Determine the original set of data.
-
Q22: Construct a frequency polygon for the data.
-
Q23: Construct a frequency polygon for the data.
-
Q24: Construct a frequency polygon for the data.
-The
Q25: Construct the requested ogive.
-The grade point averages
Q26: Construct the requested ogive.
-The heights (in inches)
Q27: Construct the requested ogive.
-The grade point averages
Q28: Construct the requested ogive.
-The heights (in inches)
Q29: Explain what is misleading about the graphic.
-
Unlock this Answer For Free Now!
View this answer and more for free by performing one of the following actions

Scan the QR code to install the App and get 2 free unlocks

Unlock quizzes for free by uploading documents