SAS was used to compare the high school dropout rates for the 30 school districts in one city in 2010 and 2012. The box plots generated for these dropout rates are shown below.Compare the center of the distributions and the variation of the distributions for the two years. 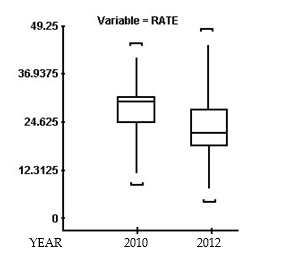
A) Dropout rates had a higher average with more variability in 2010 than in 2012.
B) Dropout rates had a higher average with less variability in 2010 than in 2012.
C) Dropout rates had a lower average with less variability in 2010 than in 2012.
D) Dropout rates had a lower average with more variability in 2010 than in 2012.
Correct Answer:
Verified
Q56: Health care issues are receiving much attention
Q57: A group of 79 students were asked
Q58: The selling prices of mutual funds change
Q59: A group of 79 students were asked
Q60: Given the following five-number summary, find
Q61: Given the following five-number summary, find the
Q62: The following is a sample of 19
Q63: A random sample of sale prices of
Q64: The test scores of 30 students are
Q65: The cholesterol levels (in milligrams per deciliter)
Unlock this Answer For Free Now!
View this answer and more for free by performing one of the following actions

Scan the QR code to install the App and get 2 free unlocks

Unlock quizzes for free by uploading documents