A company has the data shown in the chart below concerning its forecast performance over the past five time periods.
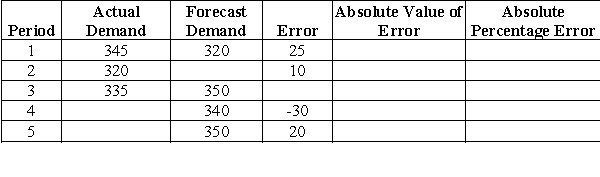
-Calculate the actual demand for Period 5.
A) 330
B) 350
C) 370
D) 390
E) 310
Correct Answer:
Verified
Q10: A firm's demand data from the last
Q11: A firm's demand data from the last
Q12: A company has the information shown in
Q13: A company has the information shown in
Q14: A company has the data shown in
Q16: A company has the data shown in
Q17: A company has the data shown in
Q18: A company has the data shown in
Q19: A company has the data shown in
Q20: A company has the data shown in
Unlock this Answer For Free Now!
View this answer and more for free by performing one of the following actions

Scan the QR code to install the App and get 2 free unlocks

Unlock quizzes for free by uploading documents