A company has the information shown in the chart below regarding its forecast performance in the past three periods.
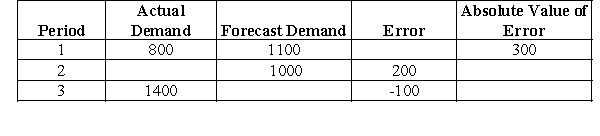
-Calculate the running sum of forecast error (RSFE) that provides a measure of forecast bias.
A) -66.67
B) -200.00
C) -300.00
D) 400.00
E) Need more information to answer the question
Correct Answer:
Verified
Q8: Q9: A firm's demand data from the last Q10: A firm's demand data from the last Q11: A firm's demand data from the last Q12: A company has the information shown in Q14: A company has the data shown in Q15: A company has the data shown in Q16: A company has the data shown in Q17: A company has the data shown in Q18: A company has the data shown in![]()
Unlock this Answer For Free Now!
View this answer and more for free by performing one of the following actions

Scan the QR code to install the App and get 2 free unlocks

Unlock quizzes for free by uploading documents