Consider the following graphs, which are discussed in the textbook. Focus on the graph that looks at the relationship between GDP per person and life expectancy. What can explain this relationship?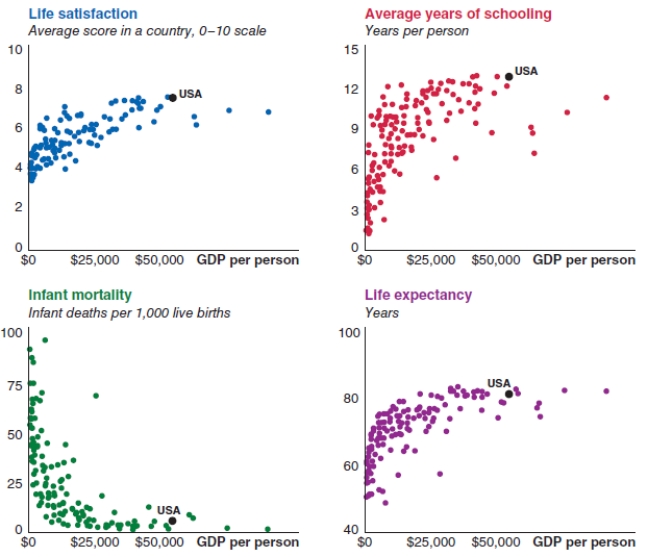
A) Higher income per person allows for better health care, sanitation, and nutrition.
B) Higher income per person leads to a higher mortality rate.
C) Lower income per person is a result of fewer years of schooling.
D) As life expectancy increases, GDP per person increases at the same rate.
Correct Answer:
Verified
Q45: When a U.S. consumer buys Canadian maple
Q46: When a U.S. consumer buys a Battenberg
Q47: Which of the following is (are) included
Q48: Dale is a stay-at-home-parent whose typical day
Q49: Consider the following graphs, which are discussed
Q51: Consider the data shown in the
Q52: Consider the data shown in the
Q53: Consider the data shown in the
Q54: Consider the data shown in the
Q55: Consider the data shown in the
Unlock this Answer For Free Now!
View this answer and more for free by performing one of the following actions

Scan the QR code to install the App and get 2 free unlocks

Unlock quizzes for free by uploading documents