Multiple Choice
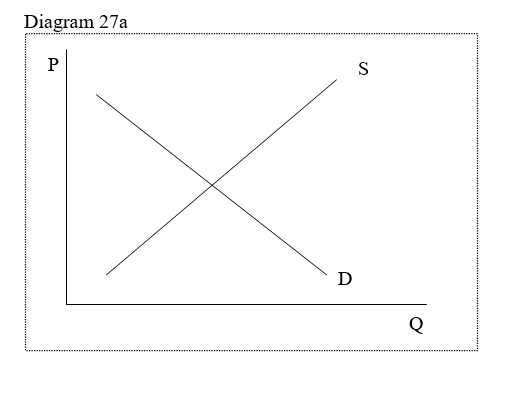
-In Diagram 27a, the supply curve represented by line S shows
A) that there is a positive relationship between price and quantity supplied.
B) that there is an inverse relationship between price and quantity supplied.
C) that the relationship between price and quantity supplied it both positive and inverse.
D) that the relationship between price and quantity supplied is circular.
Correct Answer:
Verified
Related Questions
Q66: Define cross-price elasticity and show how it
Q67: Define cross-price elasticity and show how it
Q68: Explain the limitations of elasticity (demand, supply,
Q69: Explain the limitations of elasticity (demand, supply,

