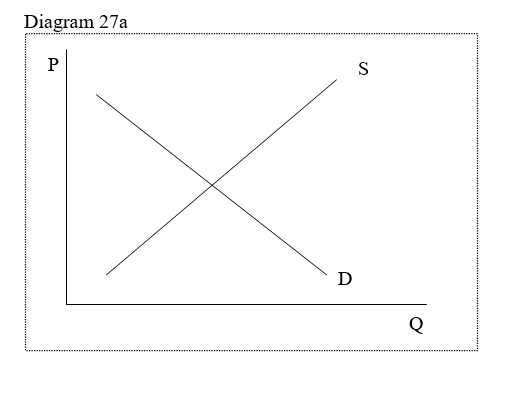
-In Diagram 27a, the demand curve represented by line D shows
A) that there is a positive relationship between price and quantity demanded.
B) that there is an inverse relationship between price and quantity demanded.
C) that the relationship between price and quantity demanded is both positive and inverse.
D) that the relationship between price and quantity demanded is circular.
Correct Answer:
Verified
Q65: Define cross-price elasticity and show how it
Q66: Define cross-price elasticity and show how it
Q67: Define cross-price elasticity and show how it
Q68: Explain the limitations of elasticity (demand, supply,
Q69: Explain the limitations of elasticity (demand, supply,
Q71: Q72: Which of the following factors may influence Q73: In the simple supply and demand diagram, Q74: Q75: Unlock this Answer For Free Now! View this answer and more for free by performing one of the following actions Scan the QR code to install the App and get 2 free unlocks Unlock quizzes for free by uploading documents![]()

