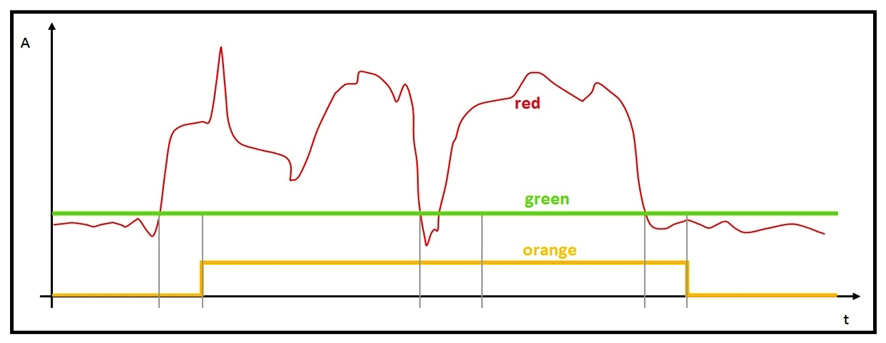
 Refer to the exhibit. The graph has been provided by the monitoring team to the IoT Engineer. The red line represents the consumption of energy from an industrial machine. Which two pieces of information can be captured? (Choose two.)
A) The green graph visualizes the mean value of the data points.
B) The green graph visualizes if the electronic device is not in stand-by mode.
C) The orange graph visualizes a boolean: power on/off.
D) The orange graph contains more information than the red graph.
Correct Answer:
Verified
Q2: A network is being configured for an
Q3: An IoT application has been built into
Q4: Which connector is southbound?
A) horizontal connector
B) cloud
Q5: An IoT engineer is responsible for security
Q6: The environment for an Industrial IoT project
Q7: Which statement explains the correct position of
Q8: Which two states are applications expected to
Unlock this Answer For Free Now!
View this answer and more for free by performing one of the following actions

Scan the QR code to install the App and get 2 free unlocks

Unlock quizzes for free by uploading documents