The bar graph below shows the regions in which all the passenger cars were produced during a recent year. What is the difference between the number of passenger cars produced in Western Europe and the number produced in Eastern Europe/Russia? 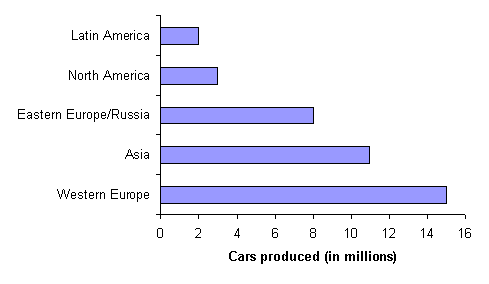
A) 24 million passenger cars
B) 7 million passenger cars
C) 11 million passenger cars
D) 10 million passenger cars
E) 23 million passenger cars
Correct Answer:
Verified
Q1: The number of seats occupied per flight
Q3: Compute Malcolm's GPA, to the nearest hundredth,
Q4: A tire company tested a particular model
Q5: Wendy took a standardized test that consisted
Q6: Joe has a 2.79 GPA after 39
Q7: Eight health maintenance organizations (HMOs) presented group
Q8: The number of big-screen televisions sold each
Q9: Beatrice has a 2.60 GPA after completing
Q10: The table below shows the age of
Q11: The table below shows the immigration rates
Unlock this Answer For Free Now!
View this answer and more for free by performing one of the following actions

Scan the QR code to install the App and get 2 free unlocks

Unlock quizzes for free by uploading documents