Multiple Choice
Which one of the following graphs represent the function: 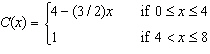
A) 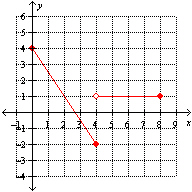
B) 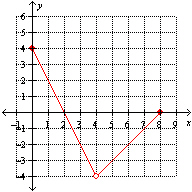
C) None of these options.
D) 
E) 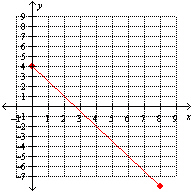
Correct Answer:
Verified
Related Questions
Q36: The mass of bacteria (in micrograms) in
Q37: Given the data below, how can you
Q38: The following table shows data for the
Q39: The number of gallons of water remaining
Q40: Using the table below, determine the value
Q42: A ball is thrown straight upward from
Q43: Given the table below, find the net
Q44: A population of rabbits was tracked over
Q45: Consider the function f(x) = 4 x
Q46: Find the domain of ![]()
Unlock this Answer For Free Now!
View this answer and more for free by performing one of the following actions

Scan the QR code to install the App and get 2 free unlocks

Unlock quizzes for free by uploading documents