The number of gallons of water remaining in a pool t hours after it began to drain is illustrated in the table below.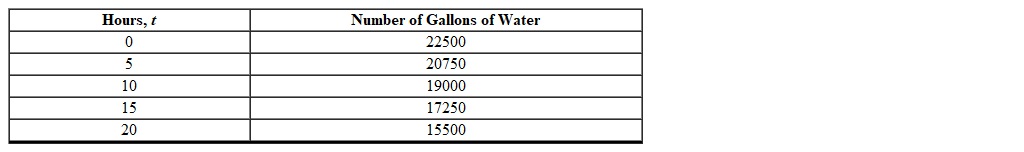
Which one of the following models this data?
A) N = 1750  350 t
350 t
B) N = 22500 + 1750 t
C) N = 22500 + 350 t
D) N = 22500  350 t
350 t
E) N = 22500  1750 t
Correct Answer:
Verified
Q34: The table below describes the average temperatures
Q35: The mass of bacteria (in micrograms) in
Q36: The mass of bacteria (in micrograms) in
Q37: Given the data below, how can you
Q38: The following table shows data for the
Q40: Using the table below, determine the value
Q41: Which one of the following graphs represent
Q42: A ball is thrown straight upward from
Q43: Given the table below, find the net
Q44: A population of rabbits was tracked over
Unlock this Answer For Free Now!
View this answer and more for free by performing one of the following actions

Scan the QR code to install the App and get 2 free unlocks

Unlock quizzes for free by uploading documents