Multiple Choice
Which one of the following graphs represent the function: 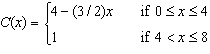
A) 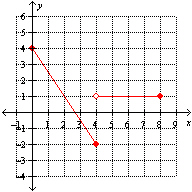
B) 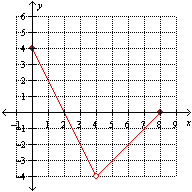
C) None of these options.
D) 
E) 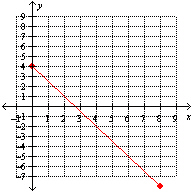
Correct Answer:
Verified
Related Questions
Q38: The table below describes the average temperatures
Q39: The number of gallons of water remaining
Q40: The mass of bacteria (in micrograms) in
Q41: The distance d (in miles) that a
Q42: The temperature (in ° F) of a
Q44: Which one of the following represents the
Q45: Given the table below find the net
Q46: Use the following graph to create an
Q47: Find the domain of Q48: A ball is thrown straight upward from![]()
Unlock this Answer For Free Now!
View this answer and more for free by performing one of the following actions

Scan the QR code to install the App and get 2 free unlocks

Unlock quizzes for free by uploading documents