The temperature (in ° F) of a town is taken at the beginning of each hour throughout one day starting at 5 a.m. Let T be the function defined by T(x) = temperature of the town at time x . Which one of the following graphs represents this scenario?
A) 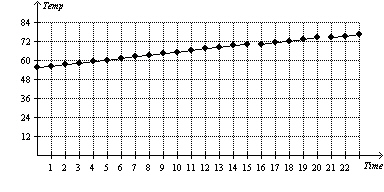
B) Not enough information
C) 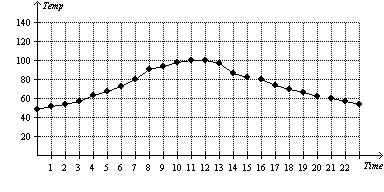
D) 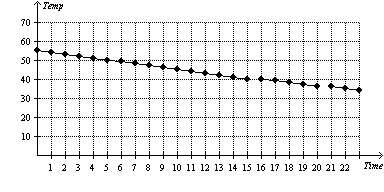
E) 
Correct Answer:
Verified
Q37: For the scatter plot below which statement
Q38: The table below describes the average temperatures
Q39: The number of gallons of water remaining
Q40: The mass of bacteria (in micrograms) in
Q41: The distance d (in miles) that a
Q43: Which one of the following graphs represent
Q44: Which one of the following represents the
Q45: Given the table below find the net
Q46: Use the following graph to create an
Q47: Find the domain of ![]()
Unlock this Answer For Free Now!
View this answer and more for free by performing one of the following actions

Scan the QR code to install the App and get 2 free unlocks

Unlock quizzes for free by uploading documents