Draw a circle graph. In 1999, U.S. nonfarm employment was as follows: manufacturing, 17.3 million
Other goods-producing industries, 5.1 million
Private service producing industries, 79.1 million
Government, 21 million
A) 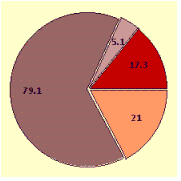
B) 
C) 
D) 
Correct Answer:
Verified
Q58: The following list gives 50 pieces
Q59: Find the median measurement for the
Q60: Find 18.2% of 360o Round your answer
Q61: Draw a circle graph. In the United
Q62: Draw a circle graph. Depict the
Q64: A bag contains 1 red marble,
Q65: A card is drawn and replaced
Q66: The highest level of education for
Q67: A large box of vegetables contains
Q68: A card is chosen from a
Unlock this Answer For Free Now!
View this answer and more for free by performing one of the following actions

Scan the QR code to install the App and get 2 free unlocks

Unlock quizzes for free by uploading documents