Draw a circle graph. In the United States for 2000, the percentage of national household income by quintiles was as follows: 1st, 4%; 2nd, 17.1%; 3rd, 36.7%; 4th, 24.4%; 5th, 17.8%.
A) 
B) 
C) 
D) 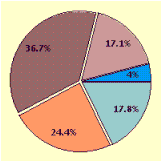
Correct Answer:
Verified
Q56: Find 48.7% of 360o Round your answer
Q57: Candidate A was one of four candidate
Q58: The following list gives 50 pieces
Q59: Find the median measurement for the
Q60: Find 18.2% of 360o Round your answer
Q62: Draw a circle graph. Depict the
Q63: Draw a circle graph. In 1999, U.S.
Q64: A bag contains 1 red marble,
Q65: A card is drawn and replaced
Q66: The highest level of education for
Unlock this Answer For Free Now!
View this answer and more for free by performing one of the following actions

Scan the QR code to install the App and get 2 free unlocks

Unlock quizzes for free by uploading documents