Use the figure below to answer the following question(s) . Figure 4-12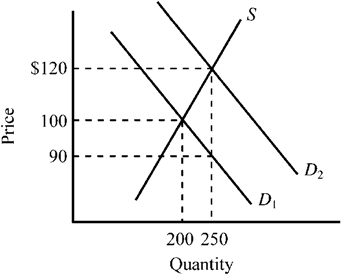 Refer to Figure 4-12. The supply curve S and the demand curve D1 indicate initial conditions in the market for college textbooks. A new government program is implemented that grants students a $30 per textbook subsidy on every textbook they purchase, shifting the demand curve from D1 to D2. Which of the following is true for this subsidy given the information provided in the exhibit?
A) Textbook buyers will receive an actual benefit of $10 from the subsidy, while textbook sellers will receive an actual benefit of $20 from the subsidy.
B) Textbook buyers will receive an actual benefit of $20 from the subsidy, while textbook sellers will receive an actual benefit of $10 from the subsidy.
C) Textbook buyers will receive the full $30 benefit from the subsidy.
D) Textbook sellers will receive the full $30 benefit from the subsidy.
Correct Answer:
Verified
Q20: The Laffer curve illustrates the concept that
A)
Q179: Use the figure below illustrating the impact
Q181: Use the figure below illustrating the impact
Q182: Use the figure below to answer the
Q183: Use the figure below to answer the
Q185: Use the figure below to answer the
Q186: Use the figure below to answer the
Q187: Use the figure below to answer the
Q188: Use the figure below to answer the
Q189: Use the figure below illustrating the impact
Unlock this Answer For Free Now!
View this answer and more for free by performing one of the following actions

Scan the QR code to install the App and get 2 free unlocks

Unlock quizzes for free by uploading documents