Use the figure below illustrating the impact of an excise tax to answer the following question(s) . Figure 4-6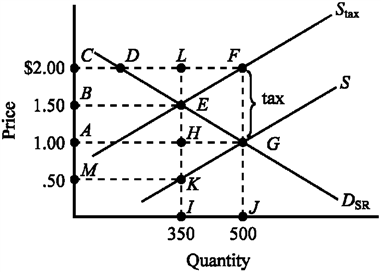 Refer to Figure 4-6. The amount of the actual tax burden paid by consumers and producers is
A) $1.00 for consumers and $.50 for producers
B) $1.00 for consumers and $1.00 for producers.
C) $.25 for consumers and $.75 for producers.
D) $.50 for consumers and $.50 for producers.
Correct Answer:
Verified
Q1: If the demand for a good is
Q15: Which of the following is the most
Q20: The Laffer curve illustrates the concept that
A)
Q179: Use the figure below illustrating the impact
Q182: Use the figure below to answer the
Q183: Use the figure below to answer the
Q184: Use the figure below to answer the
Q185: Use the figure below to answer the
Q186: Use the figure below to answer the
Q250: The market pricing system corrects an excess
Unlock this Answer For Free Now!
View this answer and more for free by performing one of the following actions

Scan the QR code to install the App and get 2 free unlocks

Unlock quizzes for free by uploading documents