Multiple Choice
Exhibit 3-3 Demand curves 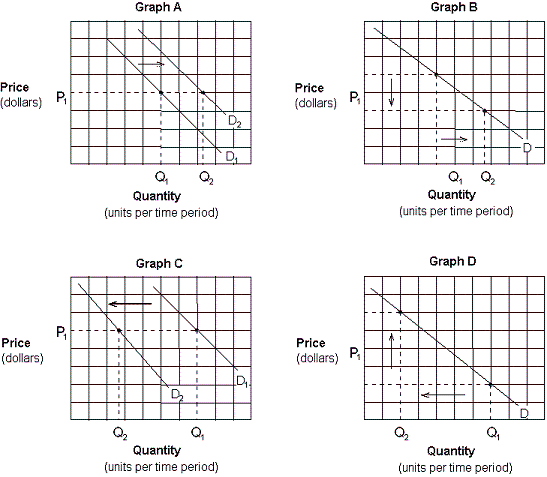
Assume that consumers expect the price of gasoline to rise sharply in the future. Which of the graphs in Exhibit 3-3 depicts this effect?
A) Graph A.
B) Graph B.
C) Graph C.
D) Graph D.
Correct Answer:
Verified
Related Questions
Q56: If people expect the price of packaged
Q63: The supply schedule shows the specific quantity
Q63: Exhibit 3-3 Demand curves Q65: In accordance with the law of supply,![]()
Unlock this Answer For Free Now!
View this answer and more for free by performing one of the following actions

Scan the QR code to install the App and get 2 free unlocks

Unlock quizzes for free by uploading documents