Exhibit 3-3 Demand curves 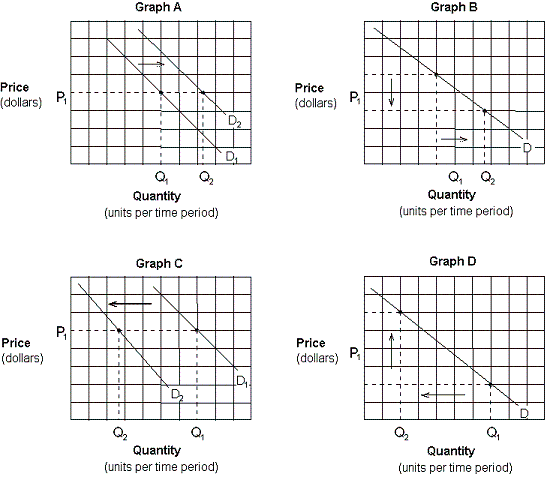
Assume that crackers and soup are complementary goods. Which of the graphs in Exhibit 3-3 depicts the effect of a promotional discount that decreases the price of crackers on the demand for soup?
A) Graph A.
B) Graph B.
C) Graph C.
D) Graph D.
Correct Answer:
Verified
Q63: The supply schedule shows the specific quantity
Q63: Exhibit 3-3 Demand curves Q65: Exhibit 3-3 Demand curves Q65: In accordance with the law of supply, Q66: A supply schedule shows the relationship between: Q68: Other things being equal, the effect of Q69: Which of the following states the definition Q74: In general, supply curves slope upward because: Q79: If a decrease in the price of Q281: According to the law of supply,![]()
![]()
A)
A)
A) producers
Unlock this Answer For Free Now!
View this answer and more for free by performing one of the following actions

Scan the QR code to install the App and get 2 free unlocks

Unlock quizzes for free by uploading documents