The figure below shows the short-run aggregate demand and supply curves of an economy. When real GDP is at Y2, _____.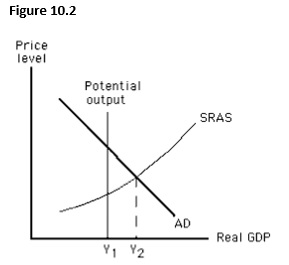
A) potential output is greater than actual output.
B) there is a recessionary gap.
C) the price level is likely to fall.
D) the actual unemployment rate is less than the natural rate of unemployment.
E) aggregate demand is likely to increase to restore equilibrium.
Correct Answer:
Verified
Q64: Which of the following occurs when an
Q67: If the expected price level exceeds the
Q75: The figure below shows the short-run aggregate
Q78: The figure below shows short-run equilibrium in
Q79: The figure below shows equilibrium in an
Q81: In the long run,an economy will produce
Q83: Which of the following does not influence
Q93: The rate at which aggregate supply changes
Q94: Which of these changes is observed in
Q97: Which of the following is true in
Unlock this Answer For Free Now!
View this answer and more for free by performing one of the following actions

Scan the QR code to install the App and get 2 free unlocks

Unlock quizzes for free by uploading documents