The figure below shows the short-run aggregate demand and supply curves of an economy. In this figure, the distance between Y1 and Y2 represents: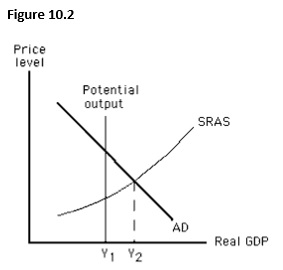
A) an expansionary gap.
B) a recessionary gap.
C) a cost-push inflation.
D) the natural rate of unemployment.
E) the full employment output.
Correct Answer:
Verified
Q64: Which of the following occurs when an
Q67: If the expected price level exceeds the
Q72: The figure below shows equilibrium in an
Q74: The figure below shows short-run equilibrium in
Q75: Which of these does not hold true
Q76: Which of the following if true would
Q78: The figure below shows short-run equilibrium in
Q79: The amount by which actual output falls
Q79: The figure below shows equilibrium in an
Q80: The figure below shows the short-run aggregate
Unlock this Answer For Free Now!
View this answer and more for free by performing one of the following actions

Scan the QR code to install the App and get 2 free unlocks

Unlock quizzes for free by uploading documents