The figure below shows the short-run aggregate supply curve of an economy. In this figure, a recessionary gap would be represented by the distance between: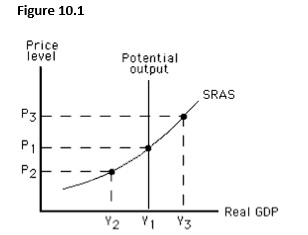
A) Y1and Y2.
B) Y1and Y3.
C) Y2and Y3.
D) P3and P1.
E) P3and P2.
Correct Answer:
Verified
Q27: If the actual price level is higher
Q41: The figure below shows the short-run aggregate
Q42: For the aggregate demand and aggregate supply
Q43: Which of the following explains the shape
Q46: The figure below shows the short-run aggregate
Q48: The figure below shows the short-run aggregate
Q48: An expansionary gap in the short-run results
Q49: In the aggregate demand-aggregate supply model,which of
Q49: The figure below shows the short-run aggregate
Q57: The long run is the period of
Unlock this Answer For Free Now!
View this answer and more for free by performing one of the following actions

Scan the QR code to install the App and get 2 free unlocks

Unlock quizzes for free by uploading documents