The figure below shows the short-run aggregate supply curve of an economy. In this figure, an expansionary gap would be represented by the distance between: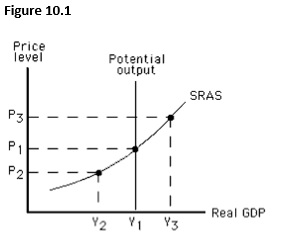
A) Y2and Y1.
B) Y3and Y1.
C) Y2and Y3.
D) P2and P1.
E) P2and P3.
Correct Answer:
Verified
Q45: The figure below shows the short-run aggregate
Q46: The figure below shows the short-run aggregate
Q48: The figure below shows the short-run aggregate
Q48: An expansionary gap in the short-run results
Q49: In the aggregate demand-aggregate supply model,which of
Q52: For the aggregate demand and aggregate supply
Q53: When actual output increases the potential output,_.
A)more
Q53: The figure below shows the short-run aggregate
Q57: The long run is the period of
Q59: An expansionary gap is equal to:
A)real GDP
Unlock this Answer For Free Now!
View this answer and more for free by performing one of the following actions

Scan the QR code to install the App and get 2 free unlocks

Unlock quizzes for free by uploading documents