Answer the following questions based on the graph below.
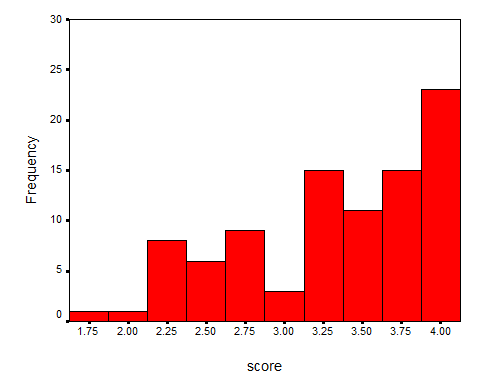
a. Is the graph symmetrical?
b. Is the graph unimodal or bimodal?
c. Do the data appear skewed? If so, positively or negatively?
d. Do there appear to be outliers? If so, for what values?
Correct Answer:
Verified
View Answer
Unlock this answer now
Get Access to more Verified Answers free of charge
Q46: The next six questions are based on
Q47: An outlier refers to data that falls
Q48: The next six questions are based on
Q49: Answer the following questions based on the
Q50: The next six questions are based on
Q52: In a frequency distribution, the number of
Q53: The following graph is unimodal.
Q54: Draw a distribution that is negatively skewed.
Q55: 87 is the midpoint of the interval
Q56: Use two terms to describe the following
Unlock this Answer For Free Now!
View this answer and more for free by performing one of the following actions

Scan the QR code to install the App and get 2 free unlocks

Unlock quizzes for free by uploading documents