The next six questions are based on the following data. 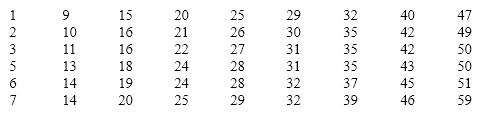
-Which graphical technique do you think displays the data least effectively? Why?
Correct Answer:
Verified
View Answer
Unlock this answer now
Get Access to more Verified Answers free of charge
Q41: When a variable has many values, and
Q42: The next six questions are based on
Q43: The next six questions are based on
Q44: The previous graph is symmetrical.
Q45: Skewness refers to how symmetrical or assymetrical
Q47: An outlier refers to data that falls
Q48: The next six questions are based on
Q49: Answer the following questions based on the
Q50: The next six questions are based on
Q51: Answer the following questions based on the
Unlock this Answer For Free Now!
View this answer and more for free by performing one of the following actions

Scan the QR code to install the App and get 2 free unlocks

Unlock quizzes for free by uploading documents