Figure 18-1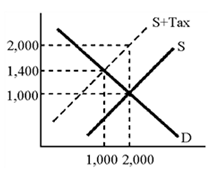
According to the graph in Figure 18-1, the increase in the amount that consumers pay as a result of the tax is
A) 1,000.00
B) 600
C) 400
D) indeterminate.
Correct Answer:
Verified
Q162: Which is not an effect of tax
Q165: The concept that describes the situation where
Q168: Suppose Mishka buys 15 apples per month
Q171: Some enterprising individuals produce and sell alcoholic
Q172: Who actually pays an excise tax
A)is determined
Q174: Which of the following taxes is most
Q177: When a tax is imposed on an
Q178: The incidence of a tax refers to
A)who
Q178: Figure 18-1 Q180: If the supply of a good is![]()
Unlock this Answer For Free Now!
View this answer and more for free by performing one of the following actions

Scan the QR code to install the App and get 2 free unlocks

Unlock quizzes for free by uploading documents