Multiple Choice
Figure 18-1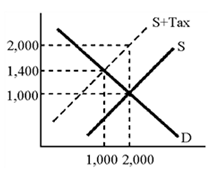
According to the graph in Figure 18-1, the tax is which of the following?
A) 400
B) 600
C) 1,000
D) 200
Correct Answer:
Verified
Related Questions
Q165: The concept that describes the situation where
Q168: Suppose Mishka buys 15 apples per month
Q171: Some enterprising individuals produce and sell alcoholic
Unlock this Answer For Free Now!
View this answer and more for free by performing one of the following actions

Scan the QR code to install the App and get 2 free unlocks

Unlock quizzes for free by uploading documents