Figure 11-2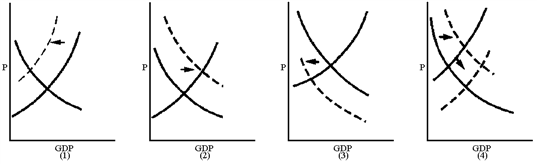
Which graph in Figure 11-2 best reflects a supply-sider's view of the impact of an increase in the personal income tax rate?
A) 1
B) 2
C) 3
D) 4
Correct Answer:
Verified
Q161: Reductions in the personal income tax, often
Q165: Figure 11-2 Q169: Figure 11-2 Q169: Supply-side tax cuts designed to increase investment Q170: Supply-side tax cuts are more likely to Q171: Capital gains tax cuts inevitably benefit Q173: The primary goal of supply-side economics is Q174: Critics of supply-side economics argue that tax Q174: Figure 11-2 Q177: Critics of supply-side economics argue that a Unlock this Answer For Free Now! View this answer and more for free by performing one of the following actions Scan the QR code to install the App and get 2 free unlocks Unlock quizzes for free by uploading documents![]()
![]()
A)low-income workers.
B)retired![]()

