Multiple Choice
Figure 11-2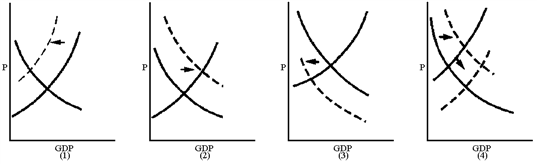
Which graph in Figure 11-2 best reflects a Keynesian view of the impact of a $500-per-person tax cut?
A) 1
B) 2
C) 3
D) 4
Correct Answer:
Verified
Related Questions
Q157: If a "conservative" wanted to increase aggregate
Q161: Reductions in the personal income tax, often
Q162: A reduction in the capital gains tax,
Q164: One objection to supply-side tax cuts is
Q166: Critics of supply-side economics argue that
A)tax cuts
Unlock this Answer For Free Now!
View this answer and more for free by performing one of the following actions

Scan the QR code to install the App and get 2 free unlocks

Unlock quizzes for free by uploading documents