Multiple Choice
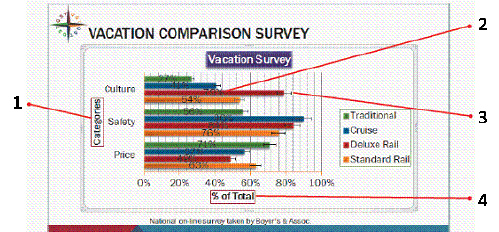 In the figure above, the error bars shown identify potential error amounts relative to each data marker in a(n) ____ series.
A) format
B) data
C) information
D) axis
Correct Answer:
Verified
Related Questions
Q1: Q4: A chart template saves _. Q5: To open the Research task pane, click Q6: Slides with relevant graphics have little impact Q7: To change slide orientation of the presentation Q8: If you don't have Excel installed on Q9: There are two ways to add a Unlock this Answer For Free Now! View this answer and more for free by performing one of the following actions Scan the QR code to install the App and get 2 free unlocks Unlock quizzes for free by uploading documents![]()
A) chart type

