FIGURE 5-3
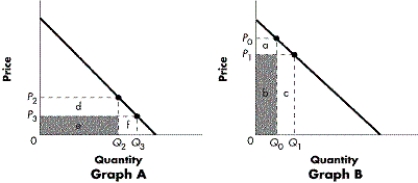
-Refer to Figure 5-3. Elasticity varies along a linear demand curve. What does Graph A represent?
A) the section of the curve where, starting at P2, a decrease in price will lead to an increase in total revenue
B) the section of the curve where Ed is < 1
C) the section of the curve where the percentage change in quantity is larger than the percentage change in price
D) the section of the curve where the curve is elastic
Correct Answer:
Verified
Q36: Which of the following is likely to
Q37: The following schedule represents a portion of
Q38: The following schedule represents a portion of
Q39: When the local symphony recently raised its
Q40: When will a price cut increase the
Unlock this Answer For Free Now!
View this answer and more for free by performing one of the following actions

Scan the QR code to install the App and get 2 free unlocks

Unlock quizzes for free by uploading documents