FIGURE 5-2
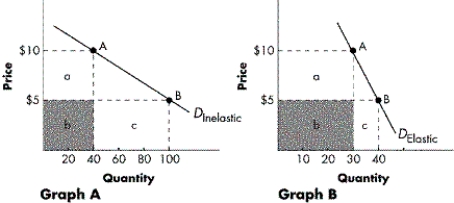
-Refer to Figure 5-2. With reference to Graph A, at a price of $10, what is total revenue equal to?
A) $200
B) $400
C) $500
D) $1000
Correct Answer:
Verified
Q37: The following schedule represents a portion of
Q38: The following schedule represents a portion of
Q39: When the local symphony recently raised its
Q40: When will a price cut increase the
Q41: FIGURE 5-3 Q43: If demand is unit elastic, what is Q44: A news report stated that movie attendance Q45: A 10 percent decrease in the price Q46: If cola and iced tea are good Q47: FIGURE 5-2
![]()
![]()
Unlock this Answer For Free Now!
View this answer and more for free by performing one of the following actions

Scan the QR code to install the App and get 2 free unlocks

Unlock quizzes for free by uploading documents