Solve the problem.
-The value of a particular car is represented in the following graph. Find the rate of change of the value of the car with respect to time, in dollars per year. 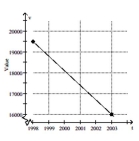
A) -$500 per year
B) -$600 per year
C) -$700 per year
D) -$750 per year
Correct Answer:
Verified
Q109: Find the slope of the line.
-3x +
Q110: Solve the problem.
-Data regarding the amount spent
Q111: Solve the problem. Q112: Find the slope of the line. Q113: Answer the question. Q115: Find the slope of the line going Q116: Find the slope of the line. Q117: Find the slope of the line going Q118: Solve the problem. Q119: Find the slope of the line.
-![]()
-y =
- The ordered pair
--3y =
-Kannanaski Rapids drops 56 ft
-3x -
Unlock this Answer For Free Now!
View this answer and more for free by performing one of the following actions

Scan the QR code to install the App and get 2 free unlocks

Unlock quizzes for free by uploading documents