Solve the problem.
-Data regarding the amount spent by a government department is represented in the following graph. Find the rate of change of the amount spent with respect to time, in billions per year. 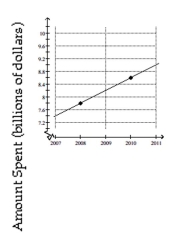 Year
Year
A) Increase of $0.10 billion per year
B) Decrease of $0.2 billion per year
C) Decrease of $0.3 billion per year
D) Increase of $0.2 billion per year
Correct Answer:
Verified
Q105: Solve the problem.
-The value of a particular
Q106: Solve the problem.
-An old house has a
Q107: Solve the problem.
-The following graph shows data
Q108: Solve the problem.
-Over one particular stretch of
Q109: Find the slope of the line.
-3x +
Unlock this Answer For Free Now!
View this answer and more for free by performing one of the following actions

Scan the QR code to install the App and get 2 free unlocks

Unlock quizzes for free by uploading documents