Multiple Choice
Solve the problem.
-The following chart shows Tech Support Inc. monthly sales by region for each of the first six months of the year. 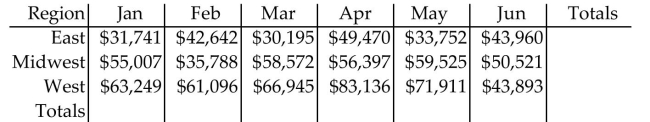
A) 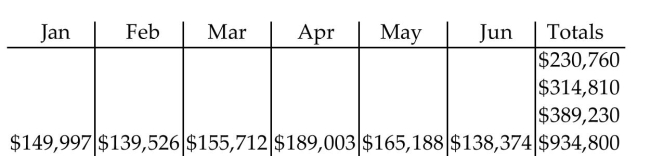
B) 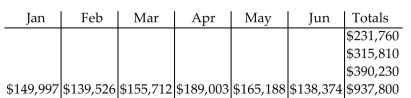
C) 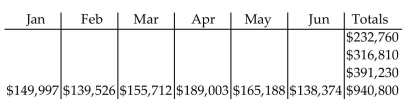
D) 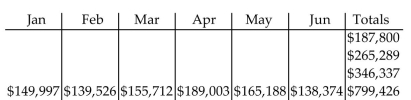
Correct Answer:
Verified
Related Questions
Q24: Solve the problem.
-Evelyn measured two rooms of
Q25: Solve the problem.
-A grocer sold 98 bags
Q26: Solve the problem.
-Richard's team wants to plant
Q27: Estimate by using front-end rounding. Q28: Round the number to the nearest thousandth,
-![]()
Unlock this Answer For Free Now!
View this answer and more for free by performing one of the following actions

Scan the QR code to install the App and get 2 free unlocks

Unlock quizzes for free by uploading documents