The bar graph shows the number of tickets sold each week by the garden club for their annual flower show. Use the
graph to answer the question(s) . 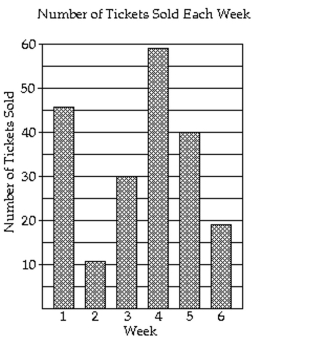
-How many more tickets were sold during week 3 than week 6?
A) 11 tickets
B) 21 tickets
C) 16 tickets
D) 49 tickets
Correct Answer:
Verified
Q27: Solve the problem.
-Elaine and Dan want to
Q28: Solve the problem.
-The following test scores were
Q29: Solve the problem.
-The circle graph below shows
Q30: The graph shows the recorded hourly temperatures
Q31: Solve the problem.
-A survey of the 7116
Q33: Solve the problem. Q34: Solve the problem.
-![]()
-In 1984, the average selling
Unlock this Answer For Free Now!
View this answer and more for free by performing one of the following actions

Scan the QR code to install the App and get 2 free unlocks

Unlock quizzes for free by uploading documents