Solve the problem.
-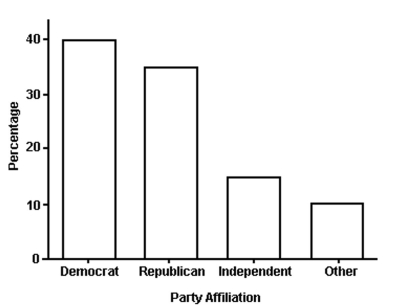 The bar graph above shows the political party affiliation of 1,000 registered U.S. voters. What percentage of the 1,000 registered U.S. voters belonged to one of the traditional two parties (Democratic and Republican) ?
A) 50%
B) 75%
C) 25%
D) 35%
E) 40%
Correct Answer:
Verified
Q30: The graph shows the recorded hourly temperatures
Q31: Solve the problem.
-A survey of the 7116
Q32: The bar graph shows the number of
Q33: Solve the problem. Q34: Solve the problem. Q36: Solve the problem. Q37: Solve the problem. Q38: Solve the problem. Q39: Solve the problem. Q40: Solve the problem.
-![]()
-In 1984, the average selling
-Yvonne decided to drive home
-Brandon kept track of the
-A local animal shelter accepts
-The circle graph below shows
-Frank's Furniture employees earned the
Unlock this Answer For Free Now!
View this answer and more for free by performing one of the following actions

Scan the QR code to install the App and get 2 free unlocks

Unlock quizzes for free by uploading documents