The circle graph below shows the number of pizzas consumed by college students in a typical month. Use the graph to
answer the question. 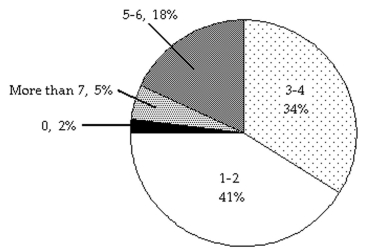
-If State University has approximately 33,000 students, about how many would you expect to consume 5-6 pizzas in a typical month?
A) 5940 students
B) 1122 students
C) 594 students
D) 11,220 students
Correct Answer:
Verified
Q147: Solve. Round answers to the nearest cent.
-A
Q148: Solve. Round answers to the nearest cent.
-A
Q149: Solve. Round to the nearest tenth, if
Q150: Solve. Round answers to the nearest cent.
-A
Q151: Solve. Round to the nearest hundredth, if
Q153: Solve. Round to the nearest tenth, if
Q154: Solve. Round answers to the nearest cent.
-An
Q155: Solve. Round to the nearest hundredth, if
Q156: Solve. Round answers to the nearest cent.
-A
Q157: The circle graph below shows the number
Unlock this Answer For Free Now!
View this answer and more for free by performing one of the following actions

Scan the QR code to install the App and get 2 free unlocks

Unlock quizzes for free by uploading documents