The circle graph below shows the number of pizzas consumed by college students in a typical month. Use the graph to
answer the question. 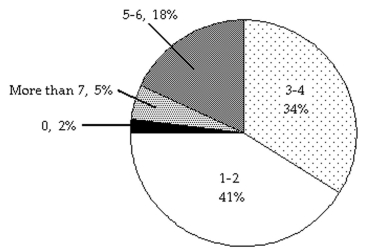
-What percent of college students consume more than 7 pizzas in a typical month?
A) 34%
B) 18%
C) 5%
D) 2%
Correct Answer:
Verified
Q152: The circle graph below shows the number
Q153: Solve. Round to the nearest tenth, if
Q154: Solve. Round answers to the nearest cent.
-An
Q155: Solve. Round to the nearest hundredth, if
Q156: Solve. Round answers to the nearest cent.
-A
Q158: Solve.
-Sales at a local ice cream shop
Q159: Solve. Round to the nearest tenth, if
Q160: Solve. Round answers to the nearest cent.
-An
Q161: Solve the inequality. Q162: Solve the inequality.
-
-
Unlock this Answer For Free Now!
View this answer and more for free by performing one of the following actions

Scan the QR code to install the App and get 2 free unlocks

Unlock quizzes for free by uploading documents