Consider a genetic network consisting of gene A whose product activates the transcription of gene R. Imagine that the concentration of protein A is suddenly changed by a significant amount. The following graphs show how the concentration of protein R would then change over time to reach steady state again. The two curves (1 and 2) in each graph correspond to systems that have different transcription rates for A. For one of the two graphs (A or B) a negative feedback loop is present, in which protein R represses the transcription of gene A. Which conclusion is correct according to these results? 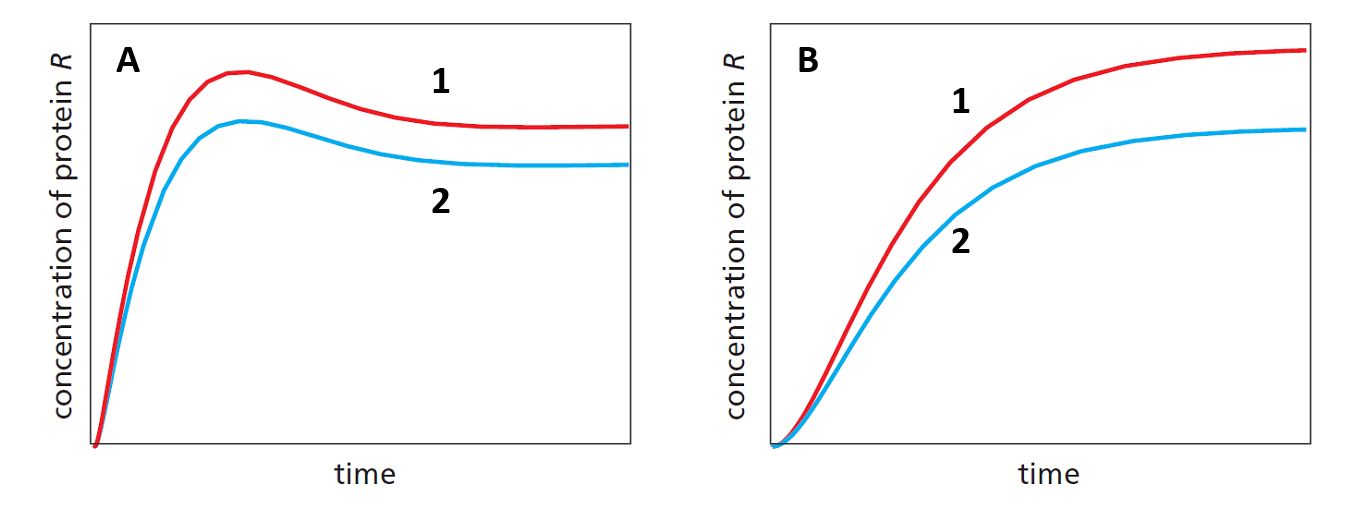
A) The negative feedback loop makes the system slower in reaching the steady state.
B) With negative feedback, the steady-state concentration is less sensitive to fluctuations in kinetic rate constants.
C) Higher transcription rates for gene A result in lower steady-state levels of protein R both with and without negative feedback.
D) All of the above.
Correct Answer:
Verified
Q85: You have set up a system of
Q86: The following graph shows the change in
Q87: Indicate whether each of the following better
Q88: Indicate which of the following network motifs
Q89: Bistability in a biological system can be
Q91: In the schematic graphs below, the red
Q92: The quantitative output of a gene depends
Q93: Imagine a bistable system composed of two
Q94: Consider two proteins A and B with
Q95: Consider a promoter sequence with n binding
Unlock this Answer For Free Now!
View this answer and more for free by performing one of the following actions

Scan the QR code to install the App and get 2 free unlocks

Unlock quizzes for free by uploading documents