Multiple Choice
Solve the problem.
-An accountant tabulated a firm's profits for four recent years in the following table:
The accountant then fit both a linear graph and an exponential curve (seen below) to the data, in order to estimat profits. Use the exponential graph to estimate the profits in the year 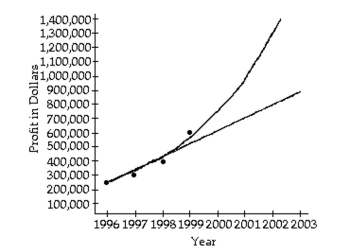
A) About
B) About
C) About
D) About
Correct Answer:
Verified
Related Questions
Unlock this Answer For Free Now!
View this answer and more for free by performing one of the following actions

Scan the QR code to install the App and get 2 free unlocks

Unlock quizzes for free by uploading documents