Investigators studying the relation between gender and the interests of early adolescents asked boys and girls in grades 5-9 to indicate on a 7-point scale their degree of interest in topics such as Life, Sports, and Cars. The data in the scatter plot represent average levels of interest for boys and girls in grades 5 - 9.Each point represents one topic listed by the investigators.For example, boys average rating for "Opposite sex" as a 6.2, while girls on average rated their interest in this topic as 6.0 on the 7 point interest scale.This is recorded as the point (6.2, 6.0). 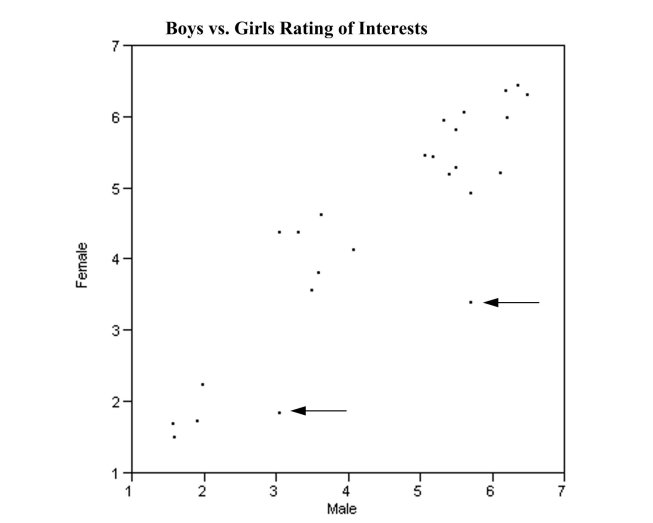 There are three interesting features of this scatter plot that you are to interpret below. What can you infer from each of these features of the scatterplot?
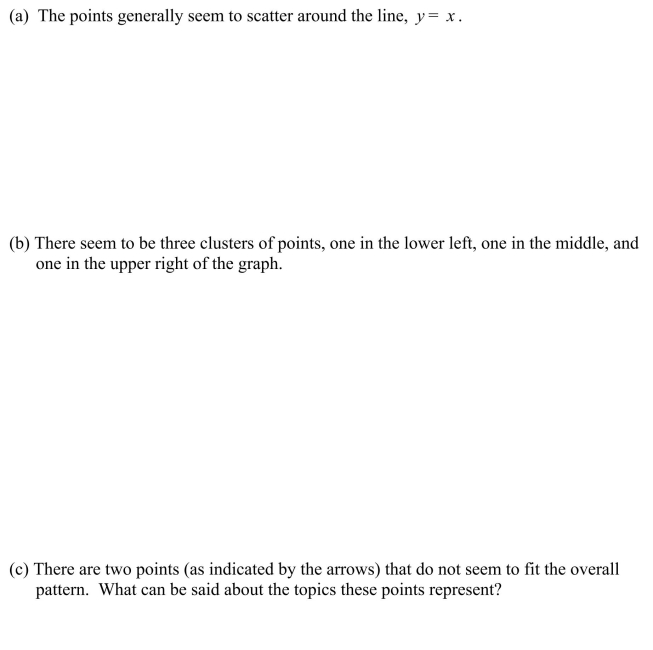
Correct Answer:
Verified
Q1: One advantage of histograms is that they
Q4: In the article, "Scaling of Mammalian Long
Q6: The stem plot below displays the weights
Q9: An outlier is an unusually small or
Q11: Ruminants are hoofed animals such as cattle
Q12: A pie chart is most useful for
Q16: In a scatter plot, both the horizontal
Q17: For stem and leaf plots with single-digit
Q18: A curve with tails that decline more
Q20: The density of a class can be
Unlock this Answer For Free Now!
View this answer and more for free by performing one of the following actions

Scan the QR code to install the App and get 2 free unlocks

Unlock quizzes for free by uploading documents