The stem plot below displays the weights (in ounces)of a random sample of tomatoes grown on a local farm 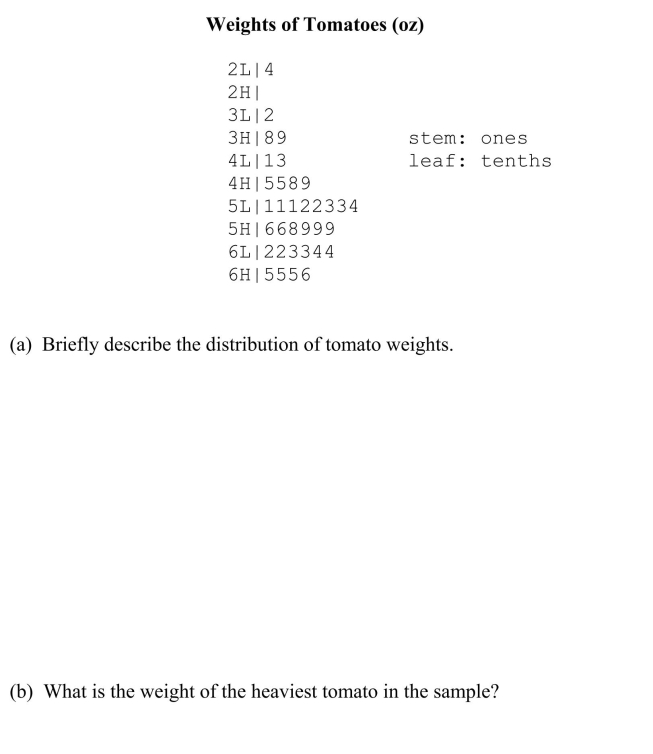
Correct Answer:
Verified
Q1: One advantage of histograms is that they
Q1: The pie chart below summarizes the results
Q4: In the article, "Scaling of Mammalian Long
Q8: If the upper tail of a distribution
Q8: Investigators studying the relation between gender and
Q9: An outlier is an unusually small or
Q11: Ruminants are hoofed animals such as cattle
Q12: A pie chart is most useful for
Q16: In a scatter plot, both the horizontal
Q18: A curve with tails that decline more
Unlock this Answer For Free Now!
View this answer and more for free by performing one of the following actions

Scan the QR code to install the App and get 2 free unlocks

Unlock quizzes for free by uploading documents