Figure: Home's Exporting Industry II
The graph shows the effect of a subsidy on a large country. 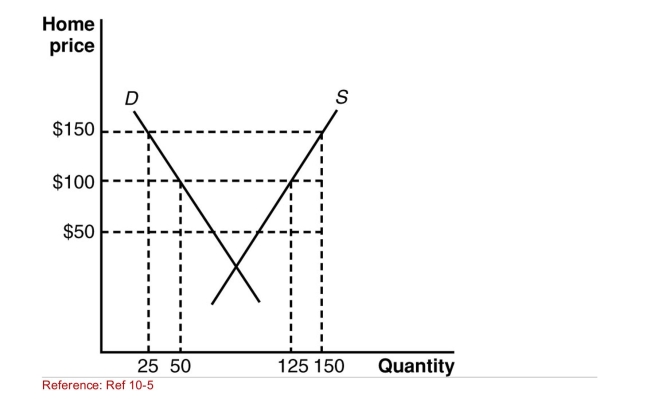
(Figure: Home's Exporting Industry II) According to the
Graph, which of the following will help the large country
Avoid the deadweight loss from the subsidy?
A) Impose a tariff.
B) Impose a quota.
C) Provide cash to developing countries to purchase the product from the home country.
D) Impose trade restrictions.
Correct Answer:
Verified
Q36: SCENARIO: DEMAND AND SUPPLY FOR IRON ORE
The
Q37: SCENARIO: DEMAND AND SUPPLY FOR IRON ORE
The
Q38: SCENARIO: DEMAND AND SUPPLY FOR IRON ORE
The
Q39: Suppose that the world price of sugar
Q40: Figure: Home's Exporting Industry I
The graph shows
Q42: Suppose that the U.S.federal government decides to
Increase
Q43: SCENARIO: FREEDONIAN EXPORTS
In the small country of
Q44: Figure: Home's Exporting Industry II
The graph shows
Q45: SCENARIO: FREEDONIAN EXPORTS
In the small country of
Q46: SCENARIO: FREEDONIAN EXPORTS
In the small country of
Unlock this Answer For Free Now!
View this answer and more for free by performing one of the following actions

Scan the QR code to install the App and get 2 free unlocks

Unlock quizzes for free by uploading documents