Figure: Home's Exporting Industry II
The graph shows the effect of a subsidy on a large country. 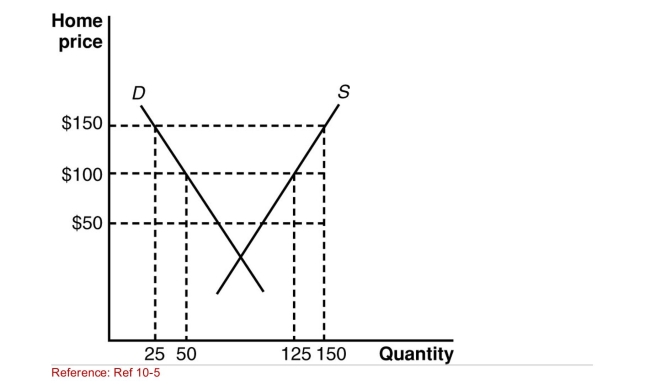
(Figure: Home's Exporting Industry II) According to the
Figure, if the world price of the product is $100, the home
Demand for the product is _____ and the exports are
______.
A) 25; 125
B) 25; 25
C) 50; 75
D) 25; 75
Correct Answer:
Verified
Q39: Suppose that the world price of sugar
Q40: Figure: Home's Exporting Industry I
The graph shows
Q41: Figure: Home's Exporting Industry II
The graph shows
Q42: Suppose that the U.S.federal government decides to
Increase
Q43: SCENARIO: FREEDONIAN EXPORTS
In the small country of
Q45: SCENARIO: FREEDONIAN EXPORTS
In the small country of
Q46: SCENARIO: FREEDONIAN EXPORTS
In the small country of
Q47: An export subsidy has a similar effect
Q48: Suppose that the world price of sugar
Q49: If a large nation subsidizes its exports,
Unlock this Answer For Free Now!
View this answer and more for free by performing one of the following actions

Scan the QR code to install the App and get 2 free unlocks

Unlock quizzes for free by uploading documents