Figure 8-1
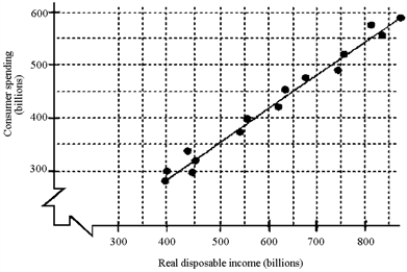
-Based on the scatter diagram in Figure 8-1, approximately how much will consumption increase after a permanent tax cut of $400 billion?
A) $100 billion
B) $150 billion
C) $250 billion
D) $350 billion
Correct Answer:
Verified
Q82: Historical data depicted on a scatter diagram
Q83: The federal government's principal tool in altering
Q84: If an economist wants to make a
Q85: The relationship between consumer spending and disposable
Q86: If real disposable income is $300 billion
Q88: Figure 8-1 Q89: The numerical value of the MPC is Q90: "Men are disposed, as a rule, and Q91: Figure 8-1 Q92: The nation's disposable income increases by $400
![]()
![]()
Unlock this Answer For Free Now!
View this answer and more for free by performing one of the following actions

Scan the QR code to install the App and get 2 free unlocks

Unlock quizzes for free by uploading documents