Figure 8-1
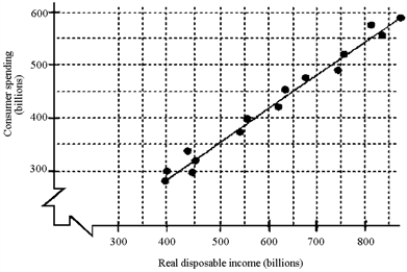
-Given the scatter diagram in Figure 8-1, what is the MPC (your best estimate) ?
A) 1/2
B) 1/3
C) 2/3
D) 1
Correct Answer:
Verified
Q86: If real disposable income is $300 billion
Q87: Figure 8-1 Q88: Figure 8-1 Q89: The numerical value of the MPC is Q90: "Men are disposed, as a rule, and Q92: The nation's disposable income increases by $400 Q93: The slope of the scatter diagram representing Q94: The marginal propensity to consume is Q95: The change in consumption divided by the Q96: Economists expect the relationship between consumption and
![]()
![]()
A)disposable income
Unlock this Answer For Free Now!
View this answer and more for free by performing one of the following actions

Scan the QR code to install the App and get 2 free unlocks

Unlock quizzes for free by uploading documents