Solve the problem.
-Some of the results of an analysis, on the makeup of garbage, are given in the following table. The table displays various years which gives the number of pounds per person per day of various types of waste materials.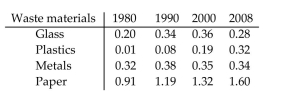
For plastics, calculate the average rates of change between consecutive data points in the table. Interpret the mea your results.
A) The rate of increase decreases from each decade to the next.
B) The rate of increase increases from each decade to the next.
C) The rate of increase decreases during the 1990 's, but then increases during 2000-2008.
D) The rate of increase increases during the 1990 's, but then decreases during the 2000-2008.
Correct Answer:
Verified
Q2: Match the numerical model to the
Q3: Match the numerical model to the
Q4: Match the numerical model to the
Q5: Solve the problem.
-The graph depicts a
Q6: Solve the problem.
-The following data set
Q7: Match the numerical model to the corresponding
Q8: Solve the problem.
-The following data set
Q9: Match the numerical model to the
Q10: Solve the problem.
-The graph shows the
Q11: Solve the problem.
-Some of the results
Unlock this Answer For Free Now!
View this answer and more for free by performing one of the following actions

Scan the QR code to install the App and get 2 free unlocks

Unlock quizzes for free by uploading documents